Use of Geofoam for I-15 Reconstruction in Salt Lake City, UT
|
Steven Bartlett, Utah Department of Transportation, Salt Lake City, UT |
|
The geofoam fill monitoring for this project is a joint project of the Utah DOT and the Geofoam Research Center. |
|
|
Project Description
|
|
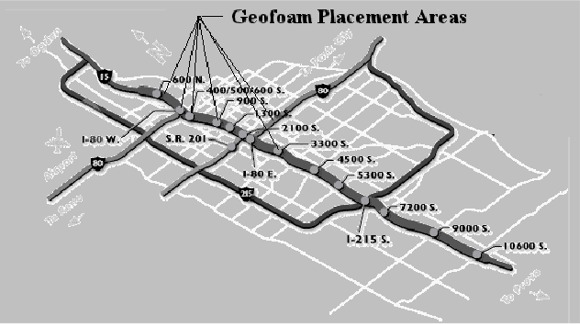
The Utah Department of Transportation (UDOT) in conjunction with Wasatch Constructors is in the process of reconstructing Interstate I-15 in Salt Lake City, Utah. The $1.5 billion design-build contract consists of modernizing I-15 from 600 North to 10600 South, approximately 27 kilometers of urban interstate (Figure 1). Construction began in May 1997 and will be completed by July, 2001 in time for the 2002 Winter Olympic Games. |
|
| Figure 1: I-15 Alignment and Geofoam Placement Areas in Salt Lake City. |
|
The project essentially widens the existing I-15 corridor with an additional general-purpose lane, a high occupancy vehicle (HOV) lane, and an auxiliary lane between ramps on both north and southbound sides of the interstate. The project will replace all existing bridges with 144 new structures. Interchanges will be constructed at 400 South and 600 North for improved downtown access, and single point urban interchanges (SPUI) will reconfigure most remaining freeway/arterial intersections (Figure 1). |
|
To accomplish the widening of the roadway within the limits of right of way, the reconstruction of the I-15 corridor will make use of approximately 160 mechanically stabilized earth (MSE) walls to construct "vertical fills." As part of this time critical project, several innovative foundation treatments and embankment construction methods have been used. These methods are being employed in areas where conventional solutions are costly or time consuming. The most innovative of which is the use of EPS blocks for light-weight fill. |
| Geofoam Applications |
|
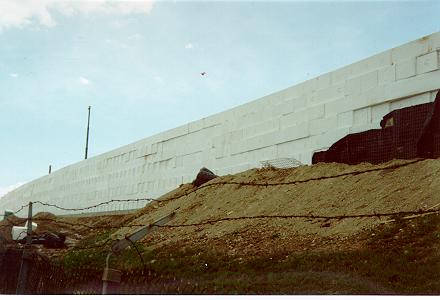
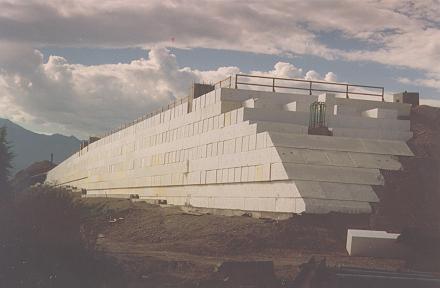
One primary application of geofoam is to minimize settlement of underground utilities. Many existing utility lines traverse areas of raised mainline or ramp embankments. These utilities consist of high pressure gas lines, water mains, and communication cables, which must remain in-service during construction. MSE embankments were predicted to induce primary settlements of up to 1 meter, exceeding strain tolerances for these buried utilities. However, when the soil mass of the MSE walls was replaced by low density geofoam the predicted settlements became minimal. This application of geofoam enabled buried utilities to remain in-place, eliminating possible expensive interruption, replacement, or relocation. Figure 2 shows a photo of a completed geofoam embankment, before installation of the tilt-up fascia panel wall at the 100 South utility corridor. |
|
|
Figure 2: A Geofoam Embankment at 100 South Utility Corridor Crossing of I-15. |
|
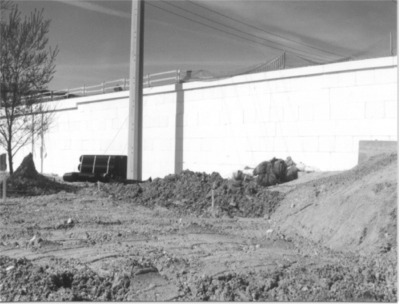
Another important use of geofoam on the I-15 project was to improve the stability of embankments. At some bridge locations high embankments were required and the associated safety factors against base failure were low. Such embankments are usually constructed with geotextile reinforcement and stage loading that require several months of delay to allow excess pore pressure dissipation and shear strength gain. Construction of embankments with geofoam provided higher safety factors against instability and allowed the construction to proceed within the critical path for the bridges. Figure 3 shows a typical bridge abutment with geofoam placed behind the abutment wall. |
|
|
Figure 3: Typical Bridge Abutment with Geofoam Backfill. |
|
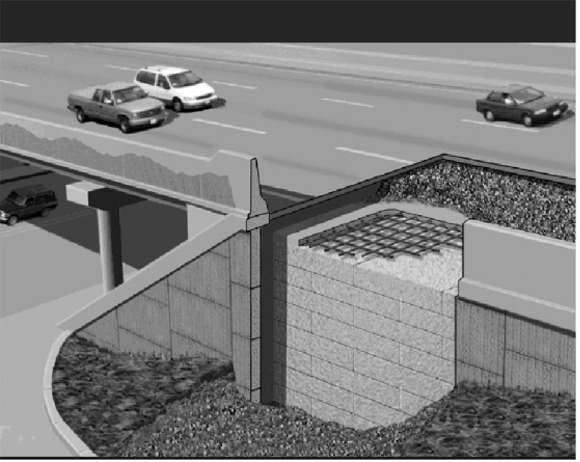
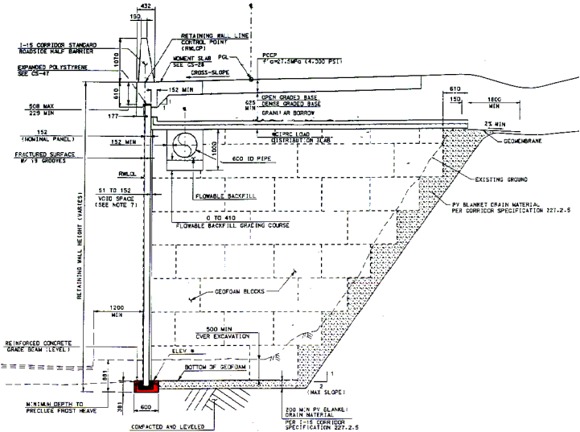
This application of geofoam eliminated stability concerns at the bridge abutments and reduced the construction time by up to 75%. In addition, geofoam approach fills induce essentially no lateral pressure on retaining structures provided the soil to geofoam fill transition is maintained at close to a self supporting repose angle, as shown in Figure 4. |
|
|
Figure 4: Details of a Typical I-15 Project Geofoam Fill. |
|
Subsurface Conditions
|
|
Extensive geotechnical investigations were conducted along the I-15 corridor by UDOT and the design-build team. Much of the Salt Lake Valley is underlain by alluvium/colluvium from the nearby Wasatch Mountains that have interfingered with relatively thick deposits (5 to 10 m layers) of lacustrine silt and clay. The lacustrine deposits originate from the Great Salt Lake and its fresh water lake predecessors that were common in the Great Basin during Tertiary time. Cone penetrometer (CPT) logs and sampling from borings reveal interbeded sand layers within the lacustrine deposits, which mark numerous transgressions/regressions of ancestral lake shores, probably due to climatic changes. The lacustrine soils are generally low plasticity clays (CL) with some layers of low plasticity silts (ML) and high plasticity clays (CH). |
|
Extensive deposits of compressible lacustrine clays and clayey silts are located in the northern segment of the I-15 in the downtown area. These deposits have a maximum thickness of approximately 25 meters and are saturated due to the shallow groundwater table (less than 2 m). Typically, these lacustrine sediments begin consolidation on the virgin compression curve when approximately 2 to 3 meters of embankment is placed. MSE walls of 8 to 10 meters in height, typically experience about 1 m of settlement due to primary consolidation of the clayey soils. In order to expedite excess pore pressure dissipation and primary consolidation, prefabricated vertical (PV) drains were placed beneath many embankments. Without PV drains, the lacustrine deposits require about 400 to 600 days to complete most of the primary consolidation. Consolidation times can be accelerated to about 100 to 200 days by the installation of PV drains, which have been typically placed on 1.5-meter triangular spacing to a depth of about 25 meters. Surcharging was extensively used to minimize the amount of expected post-construction settlements. Typically, surcharging was 30 to 40 percent of the design embankment height, which made the height of some of the temporary embankments (borrow + surcharge) up to 10 to 14 meters above original ground. However, due to its extreme light weight, geofoam embankments do not trigger primary consolidation nor result in excessive secondary consolidation settlements. Geofoam embankments were designed to produce "zero net load" on the foundation soils. This was accomplished by full load compensation or removing a volume equal to the weight added by the new construction. |
|
Standard Drawings and Specifications
|
|
Standard Drawings and specifications were developed for geofoam applications on the I-15 corridor by Wasatch Constructor's Design-Build team. Figure 4 shows details of a typical section through a geofoam fill. The fascia panel, roadside barrier as well as details for a utility trench and pipe are also shown. Table 1 lists all the geofoam standard drawings that are currently available. Copies may be obtained by request from the Research Division, Utah Department of Transportation, 4501 S. 2700 W., Salt Lake City, Utah, 84114-8410. |
|
Table 1: Geofoam Standard Drawings |
| Drawing Number | I-15 Corridor Standard Plan Title |
|
CS-42-1, CS-42-2 |
Catch Basin Down Drain in Geofoam |
|
CS-43, CS-78 |
Elevation - Geofoam Walls |
|
CS-44, CS-79 |
Geofoam Wall Panel Details |
|
CS-45, CS-80 |
Geofoam Wall Restraint Details |
|
CS-46, CS-81 |
Geofoam Wall Grade Beam Details |
|
CS-47 |
Geofoam Wall Connection Details |
|
CS-48-1 |
MSE Geofoam Conform Detail |
|
CS-48-2 |
Load Distribution Slab Parapet Wall Detail |
|
CS-49-1, CS-49-2, CS-49-3 |
Geofoam Coping at Bridges |
|
CS-50 |
Geofoam Installation at Abutments |
|
CS-51, CS-52, CS-77, CS-91, CS-92 |
Typical Geofoam Section |
|
CS-53 |
Load Distribution Slab Drain |
|
Material Properties
|
|
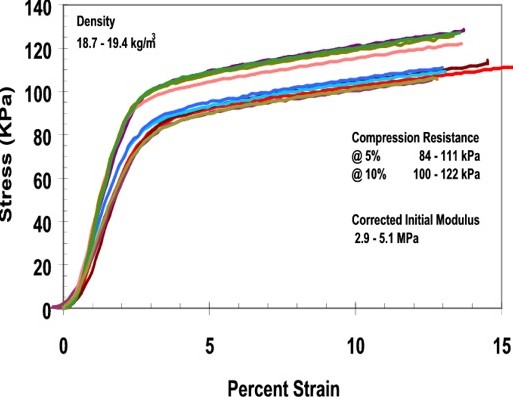
The I-15 Reconstruction Team specified geofoam with no more than five percent regrind content. Although both Type VIII and Type II geofoam (ASTM C-578) were approved, only Type VIII geofoam was used (Table 2). The blocks installed on I-15 were 0.8 m high by 1.2 m wide by 4.9 m long. The blocks, as manufactured, met the specified ± 0.5 percent dimensional and 5% flatness tolerances and trimming was not necessary. The overall design considered the nominal compressive resistance at 10 percent strain of 90 kPa for the specified Type VIII geofoam under ASTM-C-578. Actual tests performed at a strain rate of 10 percent per min on a series of standard 50 mm side cube samples, Figure 5, indicate the density consistently exceeded the 18 kg/m3 of the specification. The initial lag in the stress strain curves is due to uneven contact and must be adjusted. Corrected initial Young's moduli from these tests were in the range of 2.9 to 5.1 MPa. The compressive resistances at adjusted 5 and 10 percent strain were on average 97 and 111 kPa, respectively, with both exceeding the specification level for Type VIII geofoam in ASTM-C-578. |
|
Table 2: Material Specification for the I-15 Project. |
Physical Property (ASTM Test Procedure) |
Type VIII Value | Type II Value | Tolerances |
|
Density (D1622) |
18 kg/m3 |
22 kg/m3 |
Minimum |
|
Compressive Resistance (D1621) |
90 kN/m2 |
104 kN/m2 |
Minimum @ yield or 10 percent axial deformation |
|
Flexural Strength (C203) |
208 kN/m2 |
276 kN/m2 |
Minimum |
|
Water Absorption (C272) |
3 |
3 |
Less than % by volume |
|
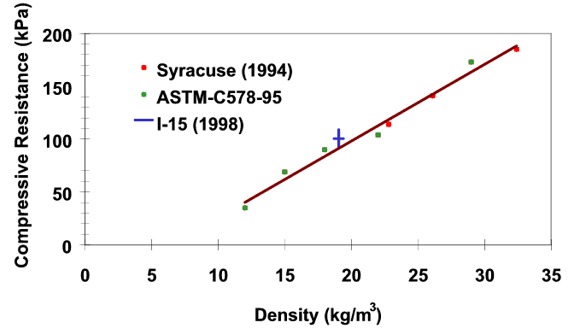
The range of densities and compression resistances at 5 percent strain represented in Figure 5 are shown in Figure 6. |
|
|
Figure 5: Stress-Strain Curves for Type VIII Geofoam, 50-mm Samples at 10% Strain Rate. |
|
|
Figure 6: Compressive Resistance versus Geofoam Density. |
|
The best fit line, equation (1), predicts compressive resistance for other densities of geofoam. A similar expression is given, equation (2), in the new European Standard (1998) for compression resistance at 10 percent strain. |
|
Sigmad = 7.3*D - 47 (1) |
|
Where Sigmad is compressive resistance in kPa and D is density in kg/m3. The 5 percent criteria generally results in a compressive resistance that is about 10 percent lower than that for the 10 percent strain level. To limit long term creep deformation of the geofoam blocks, working stress levels due to dead load were limited to 30 percent of the compressive resistance for Type VIII geofoam with an additional of up to 10 percent allowed for live load due to traffic. Such criteria have been used widely before and are believed to result in no more than 2 percent creep strain in 50 years (European Standard, 1998). An alternative approach used in Japan is to limit working stress levels to compressive resistance at 1 percent strain (Miki, 1996). The two methods can be shown to be equivalent. |
|
Corrected initial modulus values that are derived from standard tests as in Figure 5, are generally too low and over predict settlements when used in analyses (Frydenlund et al, 1996). Recent results on large block samples tested at Syracuse University now show that end effects unduly influence data from small specimens. Provided the imposed stresses are confined to induce predominantly elastic strains, the deformation that occurs in the geofoam will mostly take place during construction and post-construction deformation will be small. Thus the more meaningful modulus for practical purposes is the dynamic or resilient modulus. Because of the depth of pavement and load distribution of the concrete slab, stress increments that develop in the geofoam due to live loading are relatively small. Dynamic moduli from large block samples are of the order of more than double to triple the initial value obtained from conventional monotonic tests. Comparable initial moduli are also beginning to be observed in monotonic tests on full height samples obtained from laboratory testing and with local measurement of deformations. |
|
The behavior of EPS geofoam is strain rate dependent, particularly at higher strain levels. A lower value of compressive resistance develops with decreasing strain rate. Thus the value of specifying compressive resistance at set strain level of 5 or 10 percent and based on standard specimen sizes serves mainly as reference. There have been other projects that have been designed on the same basis and performed well. Perhaps more than confirming the validity of the methodology, the evidence that there have so far been no reported or documented cases of failed geofoam embankments suggests a reasonable degree of conservatism in current methods. |
|
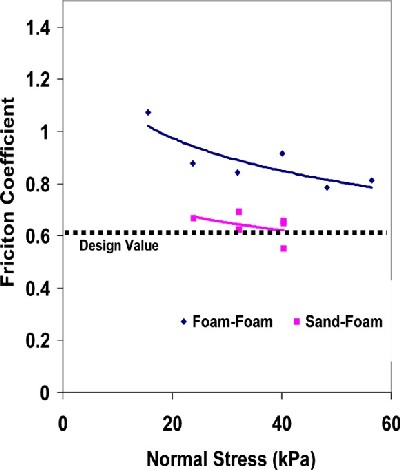
Interface shear strengths between geofoam blocks and between geofoam and bedding sand are shown in Figure 7. The test results are for a range of normal stresses due to the pavement load on the geofoam. Also shown as a lower bound envelope is the interface friction coefficient of 0.6 used in the I-15 design. The lower coefficients for the sand to foam interface imply failure at the interface would be localized to occur within the sand. Coefficients for both the foam to foam and foam to sand interfaces slightly decrease with increasing normal stress. |
|
|
Figure 7: Interface Coefficients for Type VIII Geofoam. |
|
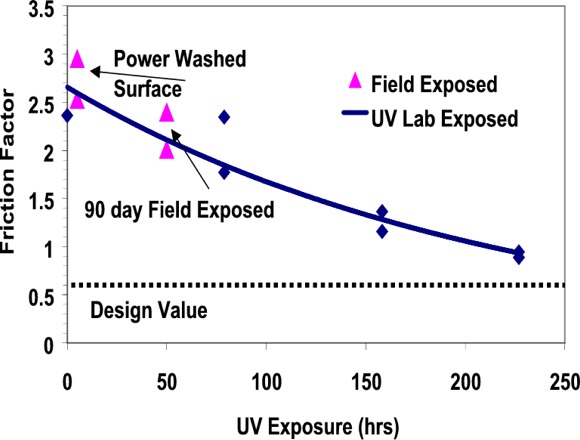
The load distribution concrete slab over the geofoam fill was cast in place. A relatively strong adhesion bond and a rough texture develops between poured in place concrete and geofoam surfaces resulting in a much higher interface strength than between foam to foam. In some cases, the scheduling of the load distribution slab construction fell behind the geofoam fill completion. The geofoam surface was exposed to prolonged duration of sunlight. Discoloration and dusting of the surface occurred due to UV degradation. The effect of surface degradation on interface strength between geofoam and cast in place concrete was investigated. Samples were subjected to accelerated UV exposure in a weatherometer and field samples exposed to the 90 days specification limit were recovered. Interface strengths determined for fresh foam, UV lab exposed surfaces and field degraded samples are shown in Figure 8. |
|
|
Figure 8: Interface Coefficients for Geofoam - Cast in Place Concrete with UV Exposure Duration. |
|
Also shown are results for field degraded but power washed geofoam to cast in place concrete interfaces. On the time scale, the 90 days of field exposure is approximated as being equivalent to 50 hours of UV exposure in the weatherometer. The design interface coefficient of 0.6 that was assumed for all interfaces involving foam is also shown as a lower bound for all of the test data. Interface strengths between geofoam and cast in-place concrete decrease with the level of UV exposure and surface degradation. Power washing before concrete pouring was effective in removing the degraded surface and enabled full regain of interface strength to a value comparable for a fresh geofoam interface. Analyses indicate the interface strength demand due to braking or acceleration of trucks can be met by a friction coefficient of less than 50 percent of the design level of 0.6. The specification requirement for covering geofoam with plastic sheeting for exposure duration beyond 90 days can be relaxed. The sheeting was an additional expense and securing for protection against wind was necessary. If desired, reconditioning of UV degraded load bearing surfaces by power washing was a better alternative. |
|
Barbed metal plates or binder plates were used with the intention of developing more interface shear resistance between geofoam blocks. However, test results performed for the I-15 Reconstruction Project indicate the plates did not provide more resistance in one way loading and were even less effective on reverse loading. While the binder plates may have helped in maintaining the blocks in position during placement, the suppliers claimed value for enhancing shear resistance was found to have been exaggerated. This conclusion supports the previously expressed opinion of Sanders et al. (1996). |
|
Solvent, Fire and Insect Protection |
|
Geofoam should be protected from potential spills of petroleum based fuels and solvents (e.g., gasoline and diesel fuel) and from fire. The load distribution slab, pavement section, and fascia panel wall are the primary protection against spills. However, in applications where the geofoam was placed on a side slope, a geomembrane liner (28 mil minimum) was provided. The geomembrane was specified as a tri-polymer consisting of polyvinyl chloride, ethylene interpolymer alloy, and polyurethane or a comparable polymer combination. A modified flame retardant resin was used for fire protection. Also, borate was added to prevent insect attack and boring intrusion. There has so far been no record of detrimental solvent or insect attack of geofoam fills for highway embankments anywhere. The extent and effectiveness of such pre-cautionary measures may need to be reviewed in future applications. |
|
Material Quality and Acceptance
|
|
The frequency of quality assurance testing was left to the discretion of the field engineer, who had the right to random sample the delivered blocks. Blocks that did not meet the project specifications upon inspection were to be rejected. The original geofoam specification stated: "any damage to the EPS resulting from the contractor's vehicles, equipment, or operations, shall be replaced by the Contractor." However, as the project progressed, minor damage to many geofoam blocks was noted and the specification was revised to define acceptable damage. Much of the damage was due to forklifts making impressions in the sides of the block, or damaging or breaking off corners of the block, as the block was moved from the delivery truck or within the stockpile. One approach for setting a realistic acceptance criteria for geofoam blocks was to limit damage to 1 percent by volume, 5 percent in load bearing area and 20 percent of the longest side for a maximum linear dimension. If only one limit was to be checked, the load bearing area restriction would be easier and more meaningful. For the standard I-15 blocks the area criteria would mean total damage of no more than 0.3 m2 (about 3.2 ft2). The damage limit would apply to one location or the sum of all damaged areas over a load-bearing surface. Damaged areas between blocks would satisfy the conditions for individual blocks but over an equivalent area. Such criteria would mean acceptance or rejection with no intermediate choice for moderate damage and repair option. Thus a damaged block either had to be cut, so as to remove the damaged portion, or replaced with a new block. |
|
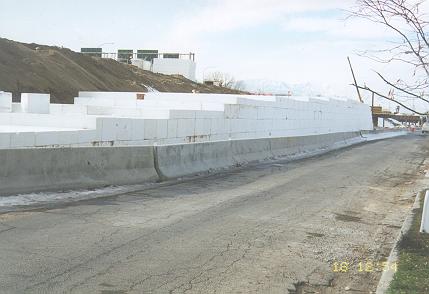
Timely covering of geofoam after placement became an issue on the I-15 project. The specification required geofoam fill exposed for more than 90 days to be covered by an opaque sheeting to prevent ultraviolet (UV) light degradation. However, some locations were not covered and surficial degradation (i.e., dusting and discoloration) of the geofoam occurred. For these areas, UDOT and the design-build team adapted a solution utilizing high-pressure washing of the geofoam surface. Prior to placing the load slab concrete, the top surface of the geofoam embankment was pressure washed to remove the degraded surface. No pressure washing was done on the side of the geofoam embankment, where the fascia panel covers the geofoam. |
|
Connections |
|
For the I-15 Reconstruction Project, the tilt-up-panel-facia wall is mechanically tied to the load distribution slab by threaded reinforcing bar placed in both elements and held together by threaded couplers. For one geofoam fill, which was 8 to 10 blocks high, this connection proved to be too rigid to accommodate some of the seating settlement within the geofoam mass and the connection was severed at a few locales. Seating settlement of approximately 3 to 4 cm, as measured by vertical extensometers, occurred during the placement of the untreated base coarse (UTBC) and Portland Cement Concrete Pavement (PCCP) above the geofoam block and load distribution slab. Seating settlement is partly caused by compression of a slight arch of individual geofoam blocks. This arch, or crown, in the geofoam blocks is visible prior to geofoam placement and is produced during ejection of the block from the mold, and subsequently while block cooling. Standard procedure by Wasatch Constructors' block installers is to place each block with the crown upward at all times. This practice allows for a relatively close fit of the block, but did not eliminate the presence of the crown, until the load of the overlying UTBC and PCCP was added. Unfortunately, the connection between the tilt-up-panel-facia wall and the load distribution slab had been made prior to the occurrence of the seating settlement. The connection detail has now been revised to permit differential movement. |
|
Cost
|
|
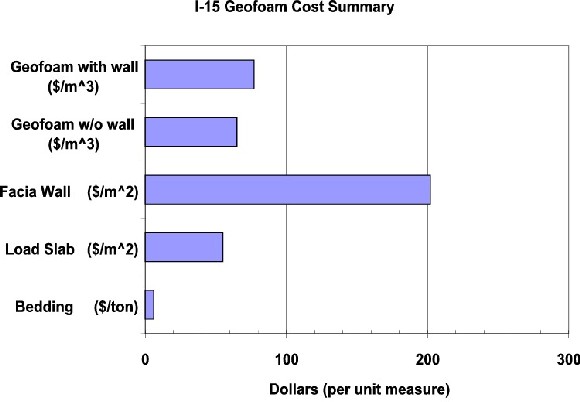
Because of the nature of the design-build contract, some of the itemized material and construction costs are not readily available. Further, making a blanket cost comparison between geofoam and earthen fills can be misleading. Each situation requires a complete review of the conditions and geometry before costs are compared. Direct costs of the foam, bedding, load slab, and facia wall must be compared to the excavation, PV drains, geotextile, fill, surcharge and construction necessary for a particular situation. Beyond the easily determined direct costs, less tangible costs must also be considered to make the comparison more meaningful. Potential improved life cycle costs to pavement, reduced construction time, elimination of utility relocation costs must be included in the evaluation. Table 3 presents an approximation of costs for the installation of geofoam on the I-15 project. The cost summary includes all labor and materials and is averaged over all applications of geofoam on the project. |
|
|
Table 3: Approximate Costs for Geofoam Installation at the I-15 Reconstruction Project. |
|
Handling and Placement
|
|
Geofoam was manufactured and stored temporarily in the manufacturer's lots. When needed, blocks were shipped in truckloads to the job site, unloaded, stored and installed within days of receipt. During storage, the foam was protected from wind with tie-downs or surcharge. Signs were posted to prevent exposure to open flames and petroleum fluids. Installation procedures did not allow for operation of equipment directly on the surface of the geofoam fills. Care in the handling and installation minimized the necessity to replace damaged blocks and was monitored by Wasatch Constructors Quality Assurance/Quality Control personnel. |
|
The bottom layer of geofoam block was placed on a 0.2 m of sand bedding. Leveling tolerances for the sand bedding and subsequent layers of geofoam were maintained at 0.01m over 3m. Blocks were placed to be tightly fitting to reduce gaps, which were usually less than 0.02m. |
|
Blocks were handled and placed in a variety of methods. Some of the placement was accomplished by hand carrying or sliding the block into place. Where steep embankment were involved, blocks were lifted down to the installation crews using a crane and cable suspension by auger type anchors secured in the block. Placement rates by a crew of four workers and a foreman slightly exceed 200 blocks per day, under optimal conditions. At times, the construction schedule required both day and night shifts, which were able to place approximately 350 blocks per day (in 2 shifts), under optimal conditions, where foundation preparation was minimal. |
|
Long Term Monitoring
|
|
Much of Wasatch Constructor's design of geofoam fills focused on reducing the impact of primary consolidation settlement in the foundation soils on underground utilities. Long-term creep settlement will also occur within the foundation soil and the geofoam fill due to the sustained load of the pavement structure. Differential creep settlements are expected to occur between deep foundation supported bridge decks, geofoam fill areas and conventional embankments. Depending on the transition grade, step settlements and gradual changes in pavement profile are expected. There is considerable uncertainty with available parameters for analysis and design of geofoam fills. These uncertainties are best bridged through comparison and design refinement based on reliable field data. To this end, the Utah Department of Transportation and the Geofoam Research Center at Syracuse University have installed instrument arrays to gather long-term performance data of the geofoam fills. The following briefly describes some of the data gathering activities. The gathered data will be presented in subsequent reports |
|
Magnet extensometers have been installed at a geofoam wall near 3500 South in the foundation soil and at intervals within the geofoam fill along common vertical axes. This monitoring program is intended to observe geofoam creep deformations over a period of at least 10 years. At this same locale, a series of total stress cells have been installed at locations above, below and within geofoam fill to observe stress distribution patterns and intensities in the geofoam embankment. So far, the stress cells have recorded successive changes in stress that have taken place with the progress of construction. Survey monuments have also been placed in the pavement overlying the geofoam to measure the total creep deformation of the geofoam embankment and to monitor for differential settlement between the geofoam and the adjacent MSE wall embankment. |
|
A nest of thermisters will be installed at depth intervals within the pavement section at locations that have and do not have underlying geofoam fill. These sensors are intended to monitor and compare the relative insulation influence of the geofoam in conditioning pavement temperatures. |
|
Also, in areas where geofoam is placed against bridge abutments, horizontal and vertical stress cells will be installed to measure the stress state (lateral and vertical) at the abutment-geofoam interface. |
|
The above sensor arrays and other field performance data gathered by Wasatch Constructors will provide an excellent opportunity to verify key design assumptions and methodologies, as well as assess the effectiveness of construction practices on the I-15 project. It is hoped that these evaluations will in turn yield future design and construction guidance for geofoam construction. |
|
Conclusion
|
|
Geofoam was successfully used as an alternative construction material for the I-15 reconstruction. Design and construction utilizing the very lightweight advantage of geofoam enabled settlement sensitive buried utilities to remain in service without need for relocation or disruption. Use of geofoam improved the base stability of high embankments. Primary consolidation settlements were not triggered and long term settlements are expected to be minimal for geofoam fill areas that were designed under no net load condition. Using geofoam at critical segments of the project has saved considerable time. Standard drawings have been developed and field monitoring is in progress. Experience gained at I-15 will benefit other like projects in the future. |
|
Acknowledgements
|
|
The authors are grateful for the support of Syracuse University and the Geofoam Research Center where the tests were performed and to Utah DOT and Wasatch Constructors. Mr. Ahmed Elragi performed several of the tests. The authors are grateful for his valuable assistance. |
|
References
|
|
Draft European Standard, (1998). European Committee for Standardization, Brussels. |
|
Duskov, M. (1997). EPS as a light-weight sub-base material in pavement structures. Ph.D. Thesis, Delft University of Technology, The Netherlands. |
|
Frydenlund, T. E. and Aaboe, R. (1996). Expanded Polystyrene -The Light Solution. Proceedings of the International Symposium on EPS Construction Method, Tokyo. |
|
Miki, G. (1996). EPS Construction Method in Japan. Proceedings of the International Symposium on EPS Construction Method, Tokyo. |
|
Negussey, D. (1997). Properties and applications of geofoam. Society of the Plastics Industry, Washington, D.C. |
|
Norwegian Road Research Laboratory (1992). Expanded polystyrene used in road embankments: Design, Construction and Quality Assurance. Form 482E. Oslo. |
|
Sanders, R. L. and Seedhouse, R. L., (1994). The use of polystyrene for embankment constructions. Contract Report 356. Transportation Research Laboratory, Crowthorne, UK |
|
|
| Additional Photos of the I-15 Reconstruction Project |
|
| Vertical EPS geofoam embankment fill. |
|
| Embankment Widening. |
|
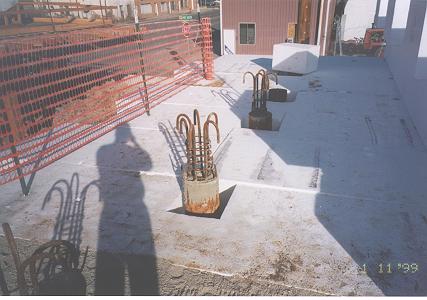
| Bridge pier extending through EPS geofoam fill. |
|
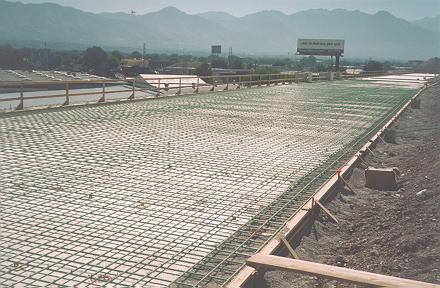
| Load Distribution Slab Reinforcement. |
|
|
|
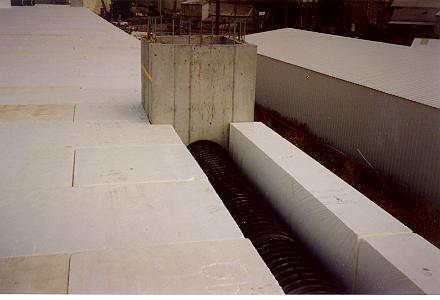
| EPS geofoam fill adjacent to storm drain. |
|
|